It’s difficult to convey accurate information in a simple and synthetic way without having the right tools and a standard model to represent them.
All this questions affect the accessibility of the information that museum and archaeological site staff try to give to their visitors, who are not expert of history or archaeology. Highlighting the whole historical context of the museum/archeological site allows the visitor to broad his knowledge deeper.
After some field research into museums/archaeological sites, and into the communication need of our costumer, we developed two different set of digital tools for the creation of cartographies/data visualizations.
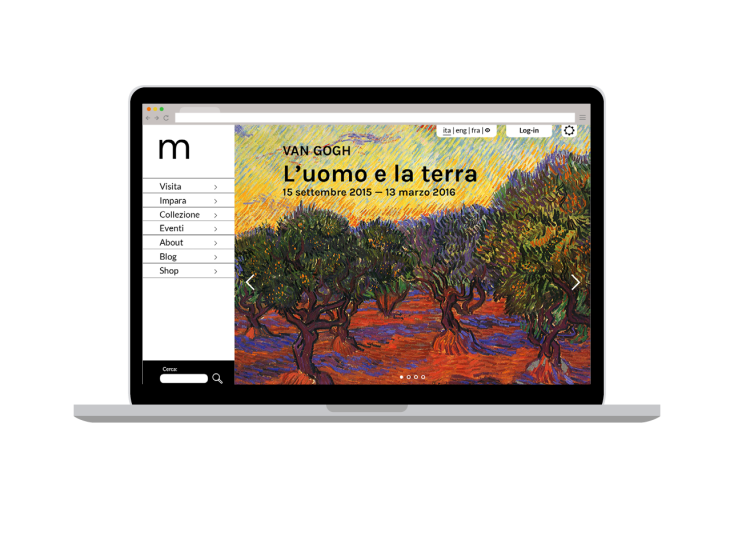
The first set of tools is made for a website which allows the user to digitally trace or draw, tag and catalog maps of various scales (either an entire archaeological city or the single museum), with a standard set of visual variables.
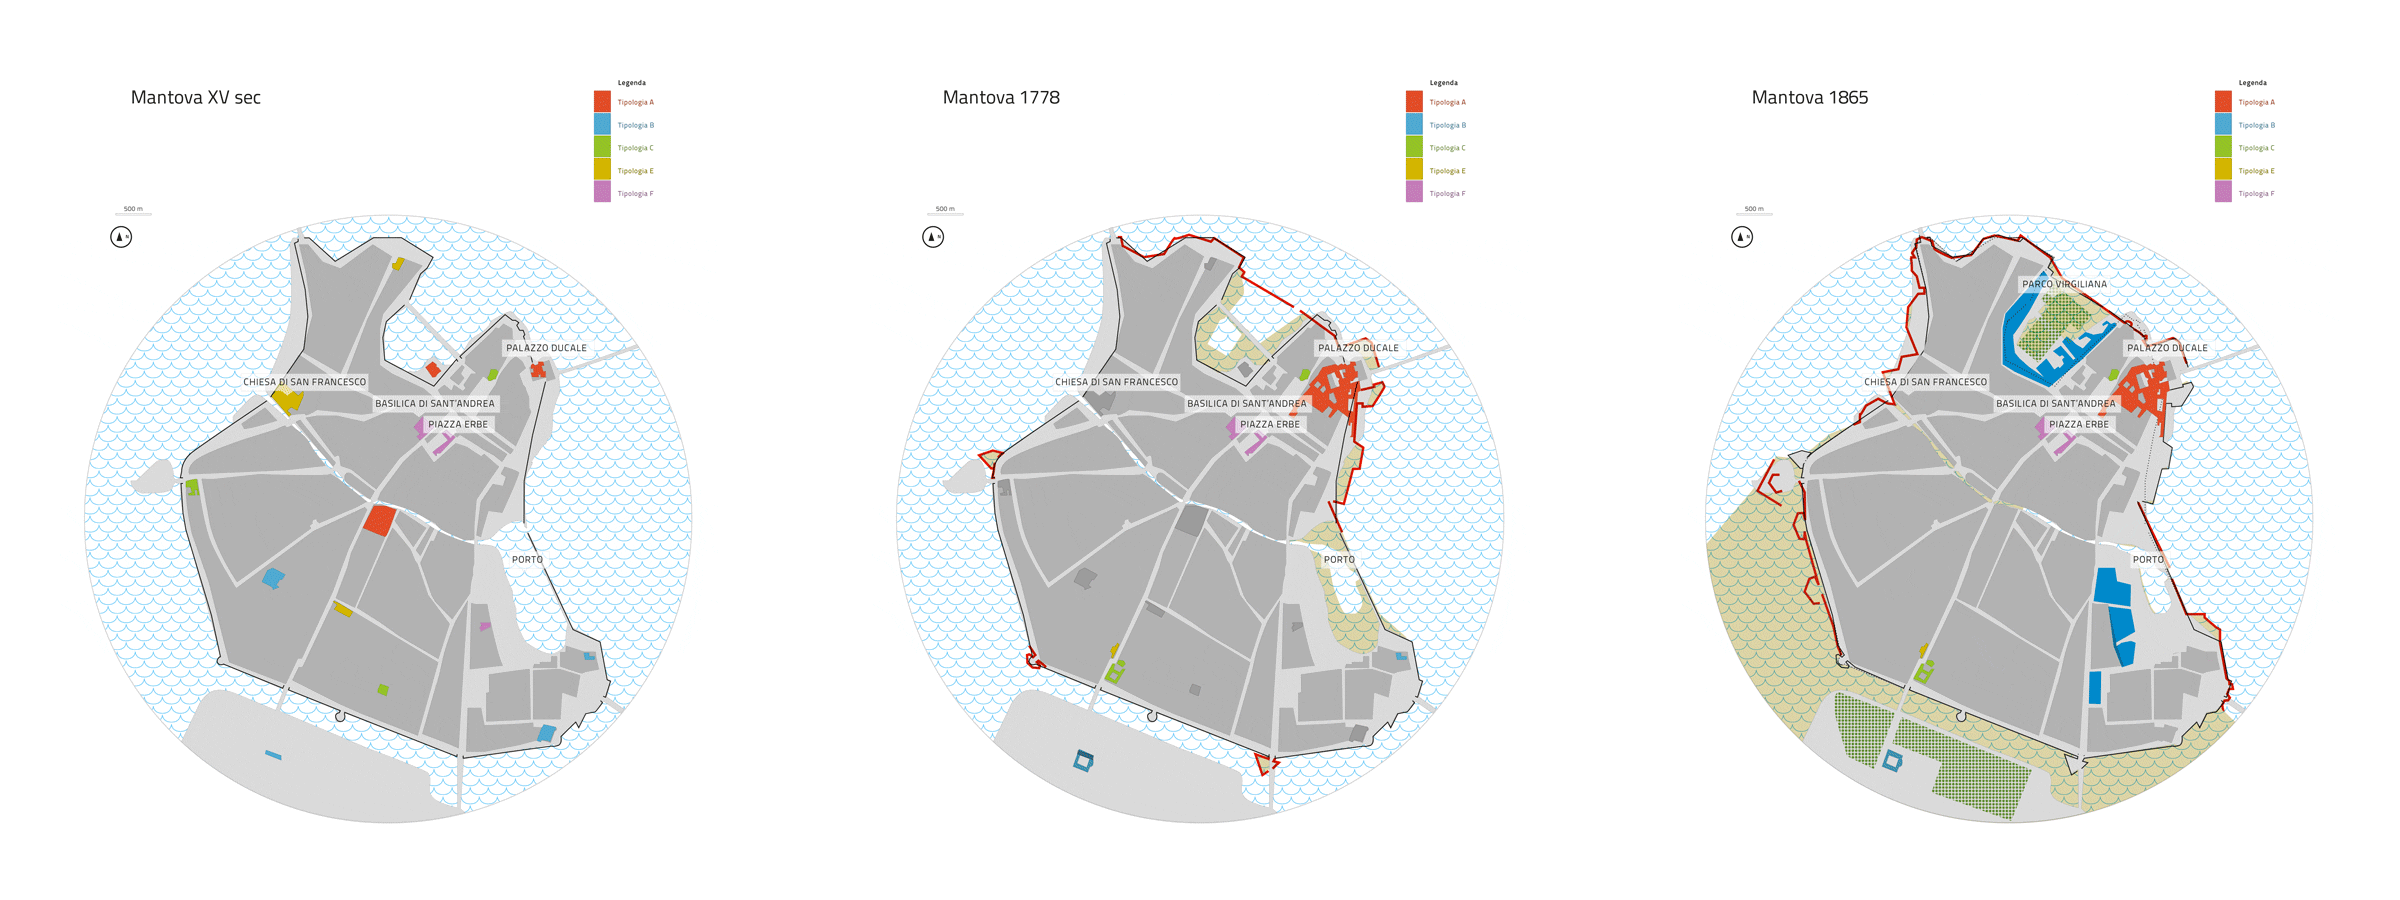
The second set of tools (which has been prototyped) allows the user to generate automatically different kinds of data visualizations (timelines, stratigraphies, maps and characters), starting from spreadsheet data.